
The Story of a Misleading Chart – How to Interpret Japanese Candlesticks
- Categorías Inversiones
Luis, a businessman determined to learn trading, faced a chart one morning that seemed clear. A huge green candle appeared on the screen. His heart raced—he thought it was the perfect moment and bought immediately. However, minutes later, the price collapsed. That candle, which looked like the promise of profit, turned into a trap. Luis thus discovered what many novice traders experience: the deception of interpreting Japanese candlesticks without context.
What Are Japanese Candlesticks?
Japanese candlesticks are graphical representations of price movement over a specific time period. Each candlestick is made up of
The body
shows the difference between the opening price and the closing price.
The wicks (or shadows)
mark the highest and lowest prices reached during that period.
The color
green indicates that the close was higher than the open (uptrend), while red indicates that the close was lower (downtrend).
A single candlestick may seem clear, but without context it can be misleading. That’s why analysis must consider complete patterns, volume, and key support and resistance levels.
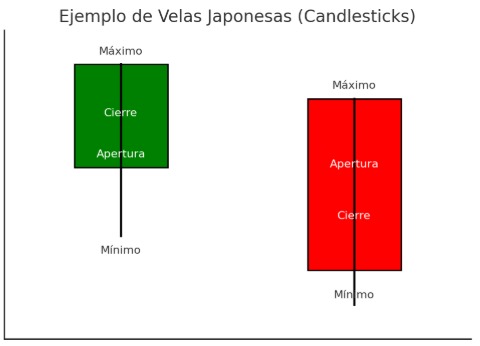
Figure 1. Example of Japanese Candlesticks: one green (bullish) candle and one red (bearish) candle.
The Deception of a Single Candle
The most common mistake is interpreting a single candlestick as a definitive signal. For example, a very long green candle may look like confirmation of an uptrend, but if it appears right at a resistance level (a zone where the price historically stalls), it’s most likely a false breakout—a move that seems to surpass a key level but quickly reverses. These traps happen all the time and catch thousands of traders.
Life and Candles: Misleading Appearances
This doesn’t happen only in the markets. In life, too, we often trust signals that seem clear: a job with a good salary but an unhealthy environment, a passionate relationship without solid foundations, or a business that promises much but lacks fundamentals. Just as a single candlestick can deceive, so can appearances in life.
Our Experience in the Markets
Since 1997, Ismael Monte de Oca has experienced the financial markets with their cycles of euphoria and fear. I, Marlen GonzaleZ, began in 2011, but even before practicing medicine I was already investing. Both of us have learned that every day in the stock market is a new lesson: what separates the beginner from the professional is the ability to interpret the full context—not just a single signal.
In our Success, Profits, and Wealth Seminar, we teach our students how to read candlesticks strategically, how to identify supports (levels where price usually stops falling) and resistances (levels where price usually stalls on the way up), and how to control emotions in the face of market traps. Because in trading, success doesn’t go to the one who trades the most, but to the one who interprets best.
Conclusion
The market—like life—is full of appearances. A single candlestick does not define a trend, and a signal without context can be dangerous. True success doesn’t come from reacting quickly, but from analyzing calmly, supported by knowledge and experience.
That’s why in our academy we teach people to invest intelligently: we don’t manage others’ money or promise magic formulas—we train independent traders capable of facing the market with confidence and clarity.